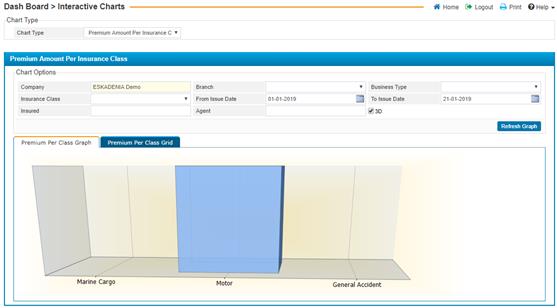
Through the Dashboard
sub-module you can view charts that are dynamically generated by the system.
Note that there is no entry required through this page.

The Interactive charts
consist of various graphs including:
§ Loss Ratio Per Class
§ Premium Amount per
Insurance Class
§ Claims Payments per
class
§ Premium growing chart
§ Premium per cover
§ Outstanding per class
Note that in order to enlarge a certain graph simply click on the graph required.